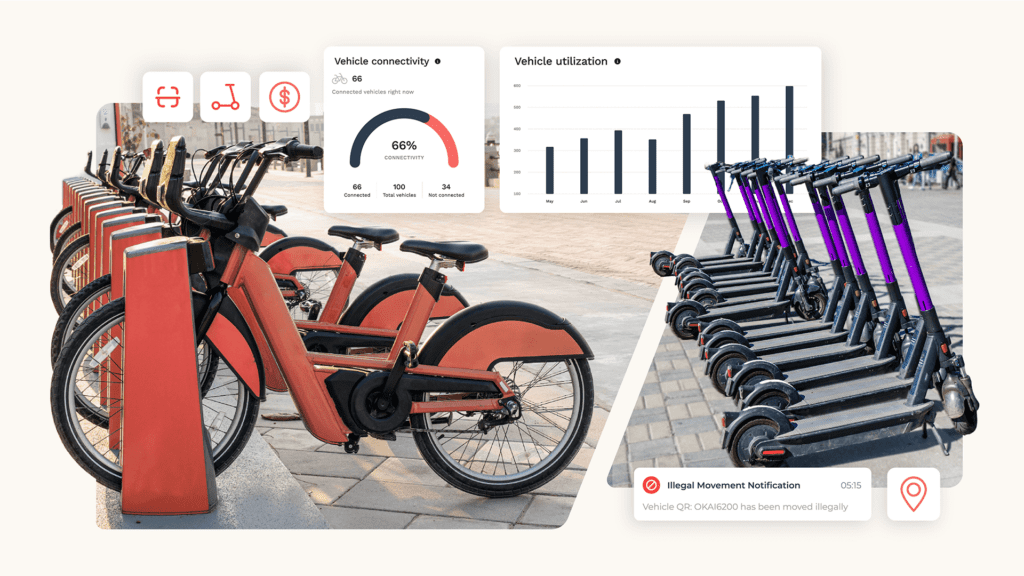
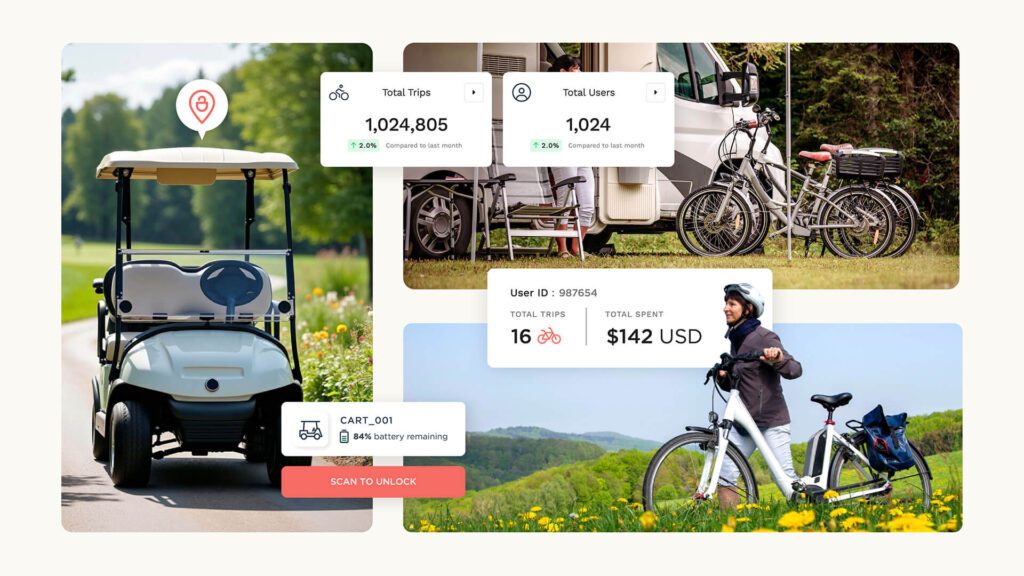
Your vehicles are generating a ton of data, but are you putting it to work?
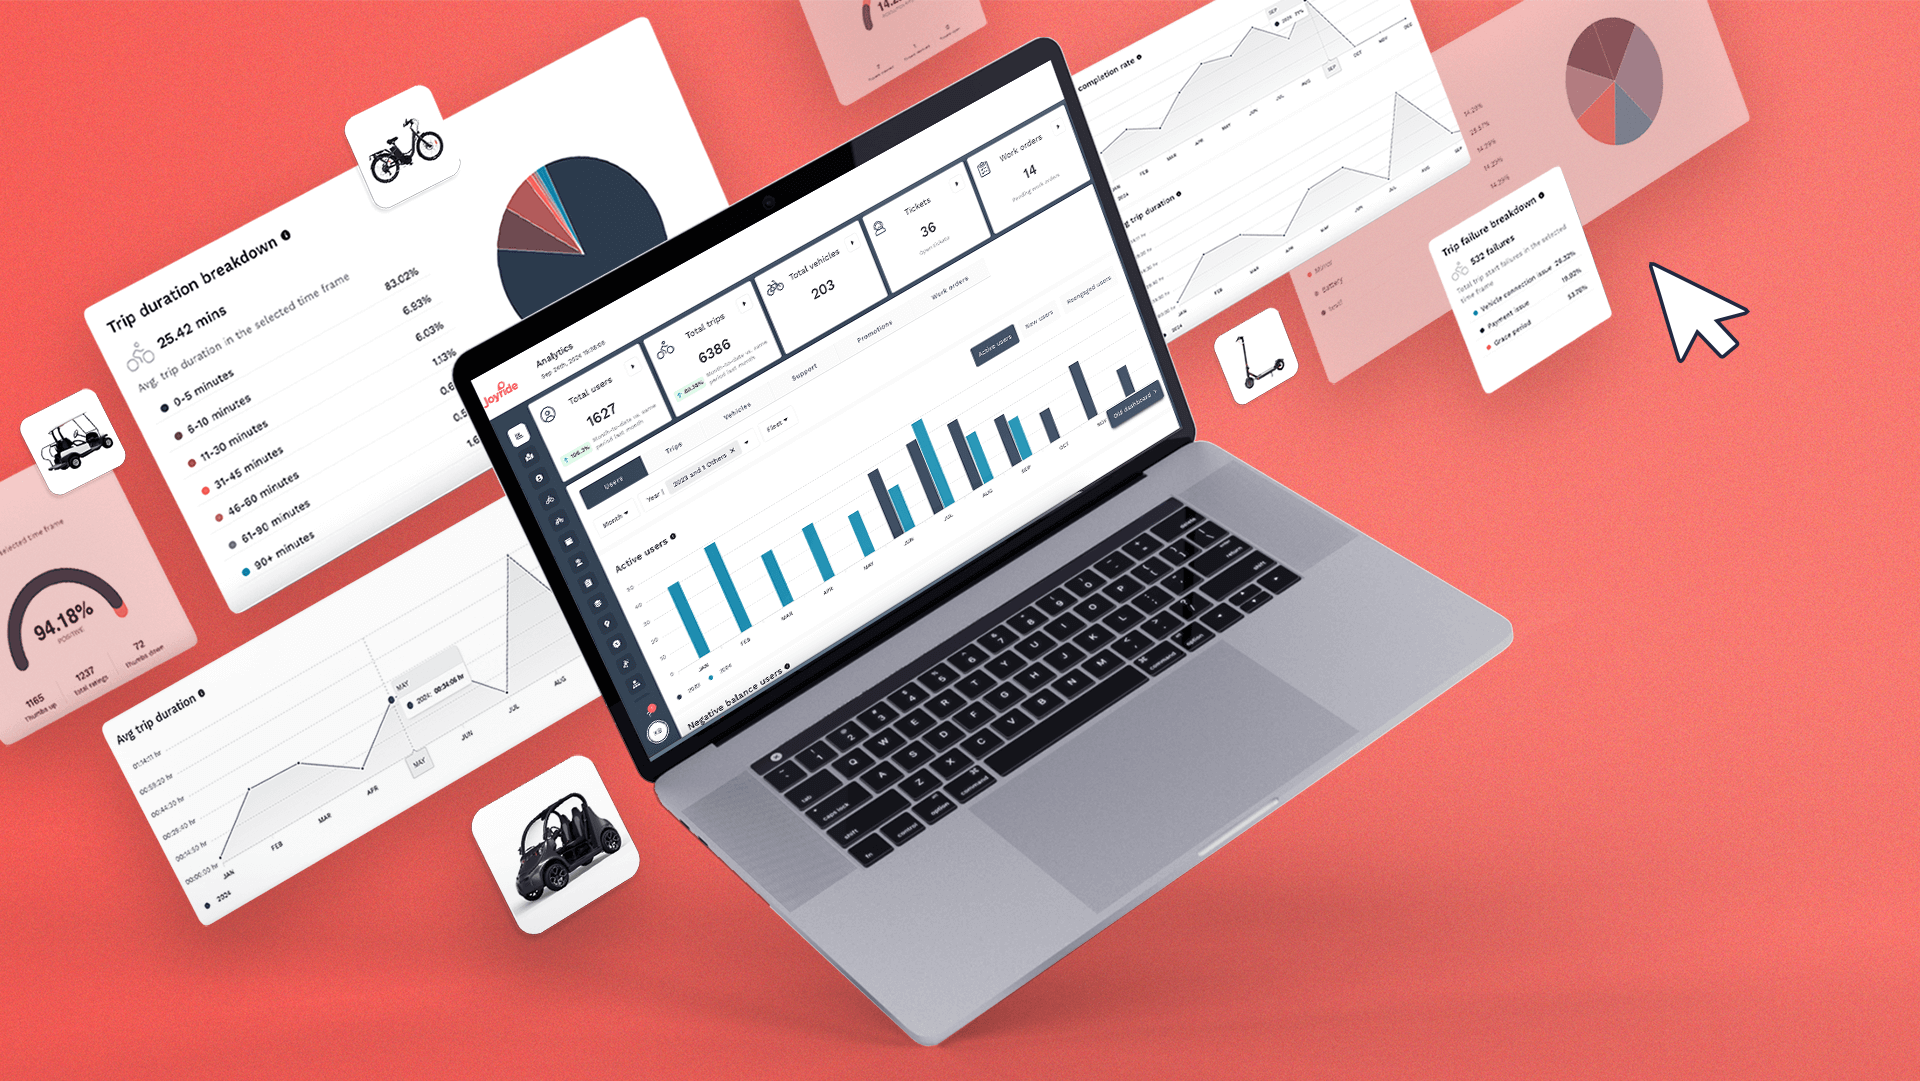
Located within our fleet management dashboard, Joyride’s new Payment Analytics and Advanced Analytics features are all about making the most of your information, so your vehicle-sharing business can grow without the guesswork.
If you’re managing electric vehicles of all sizes, it’s time to really go big with your data and tap into the most powerful fleet analytics on the market.
Here’s how Joyride’s latest upgrade makes that happen:
Payment Analytics: Streamline your fleet cash flow
Most shared mobility businesses have more than one fleet–often with different vehicle types or billing plans. Between multiple CSV exports and time-consuming calculations, operators can sink hours into the specifics of discounts, wallet credits and payouts per fleet.
Say goodbye to spreadsheets and accounting errors. Joyride’s new Payment Analytics feature gives you a clear picture of financial performance, as a whole, and on an individual fleet level.
- Detailed Payment Breakdown: Get a comprehensive look at every revenue stream. Reservation fees, trip costs, premium parking fees–it’s all accounted for in one place.
- Net Revenue: See exactly how much your customers are spending on trips, ride passes, promos, and top-ups during a selected time period.
- Fleet-Specific Revenue: Working with franchisees or servicing other businesses? Simply select a fleet and set the time period to isolate its revenue. Plus, you can easily download reports to provide data-backed assurances to operating partners.
- Failed Payments and Recovery: Don’t let underpayments slip through the cracks. This toolset helps you identify these issues and monitor how they’re being resolved.
The bottom line for fleet operators
For shared mobility and rental fleet operators, time is the most essential resource. What used to take hours (and still felt unreliable) can now be done in minutes. Joyride’s Payment Analytics makes your revenue reporting more transparent, accurate and easy to share with relevant stakeholders.
The net result? Fewer disputes, faster payouts and better financial management, ensuring you never leave money on the table again.
And that’s just the tip of the iceberg…
Advanced Analytics: Understand every aspect of your business
Payments are a critical data point, but revenue only tells part of the story. You need to dive deeper into the trends—whether it’s tracking how long trips last, pinpointing where vehicles are in demand, or determining which marketing tactics drive conversions.
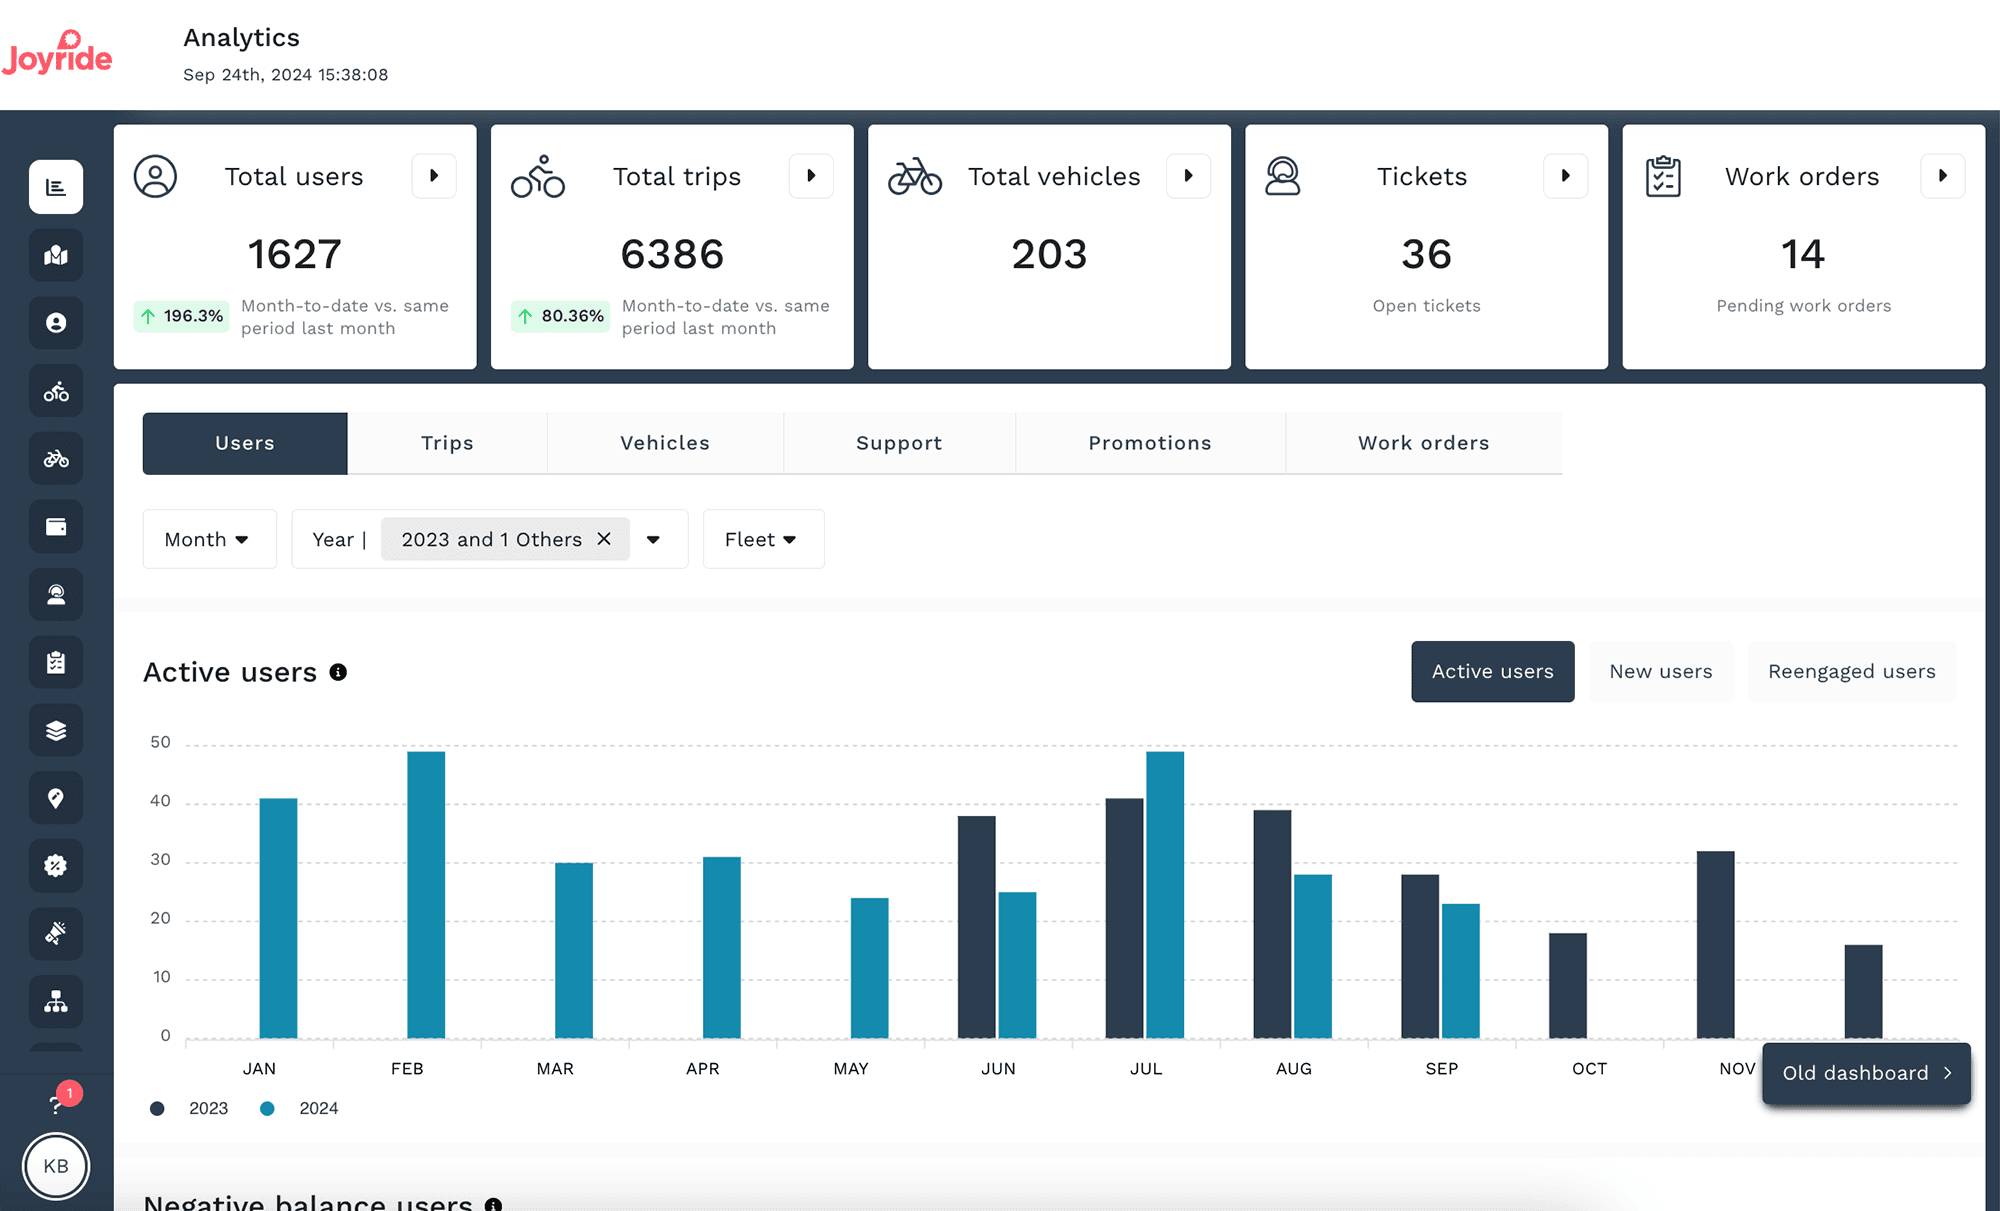
Joyride’s Advanced Analytics page provides easy access to the big picture of your shared mobility business, as well as the ability to immerse yourself in the specifics.
- See how this month’s data is performing against the same time last month with a quick percentage change.
- Compare historical data year over year, are narrow down to specifics months.
- Access Joyride’s mobile-responsive analytics on the go from a tablet or smartphone.
Here’s what else you can explore in detail:
- Active Users: Keep an eye on how many people use your service regularly, and which fleets have high retention.
- New Users: Measure the effectiveness of your customer acquisition strategies and compare month-to-month.
- Negative Balance Users: Monitor users with negative balances to identify potential financial risks before they snowball.
Trip Analytics
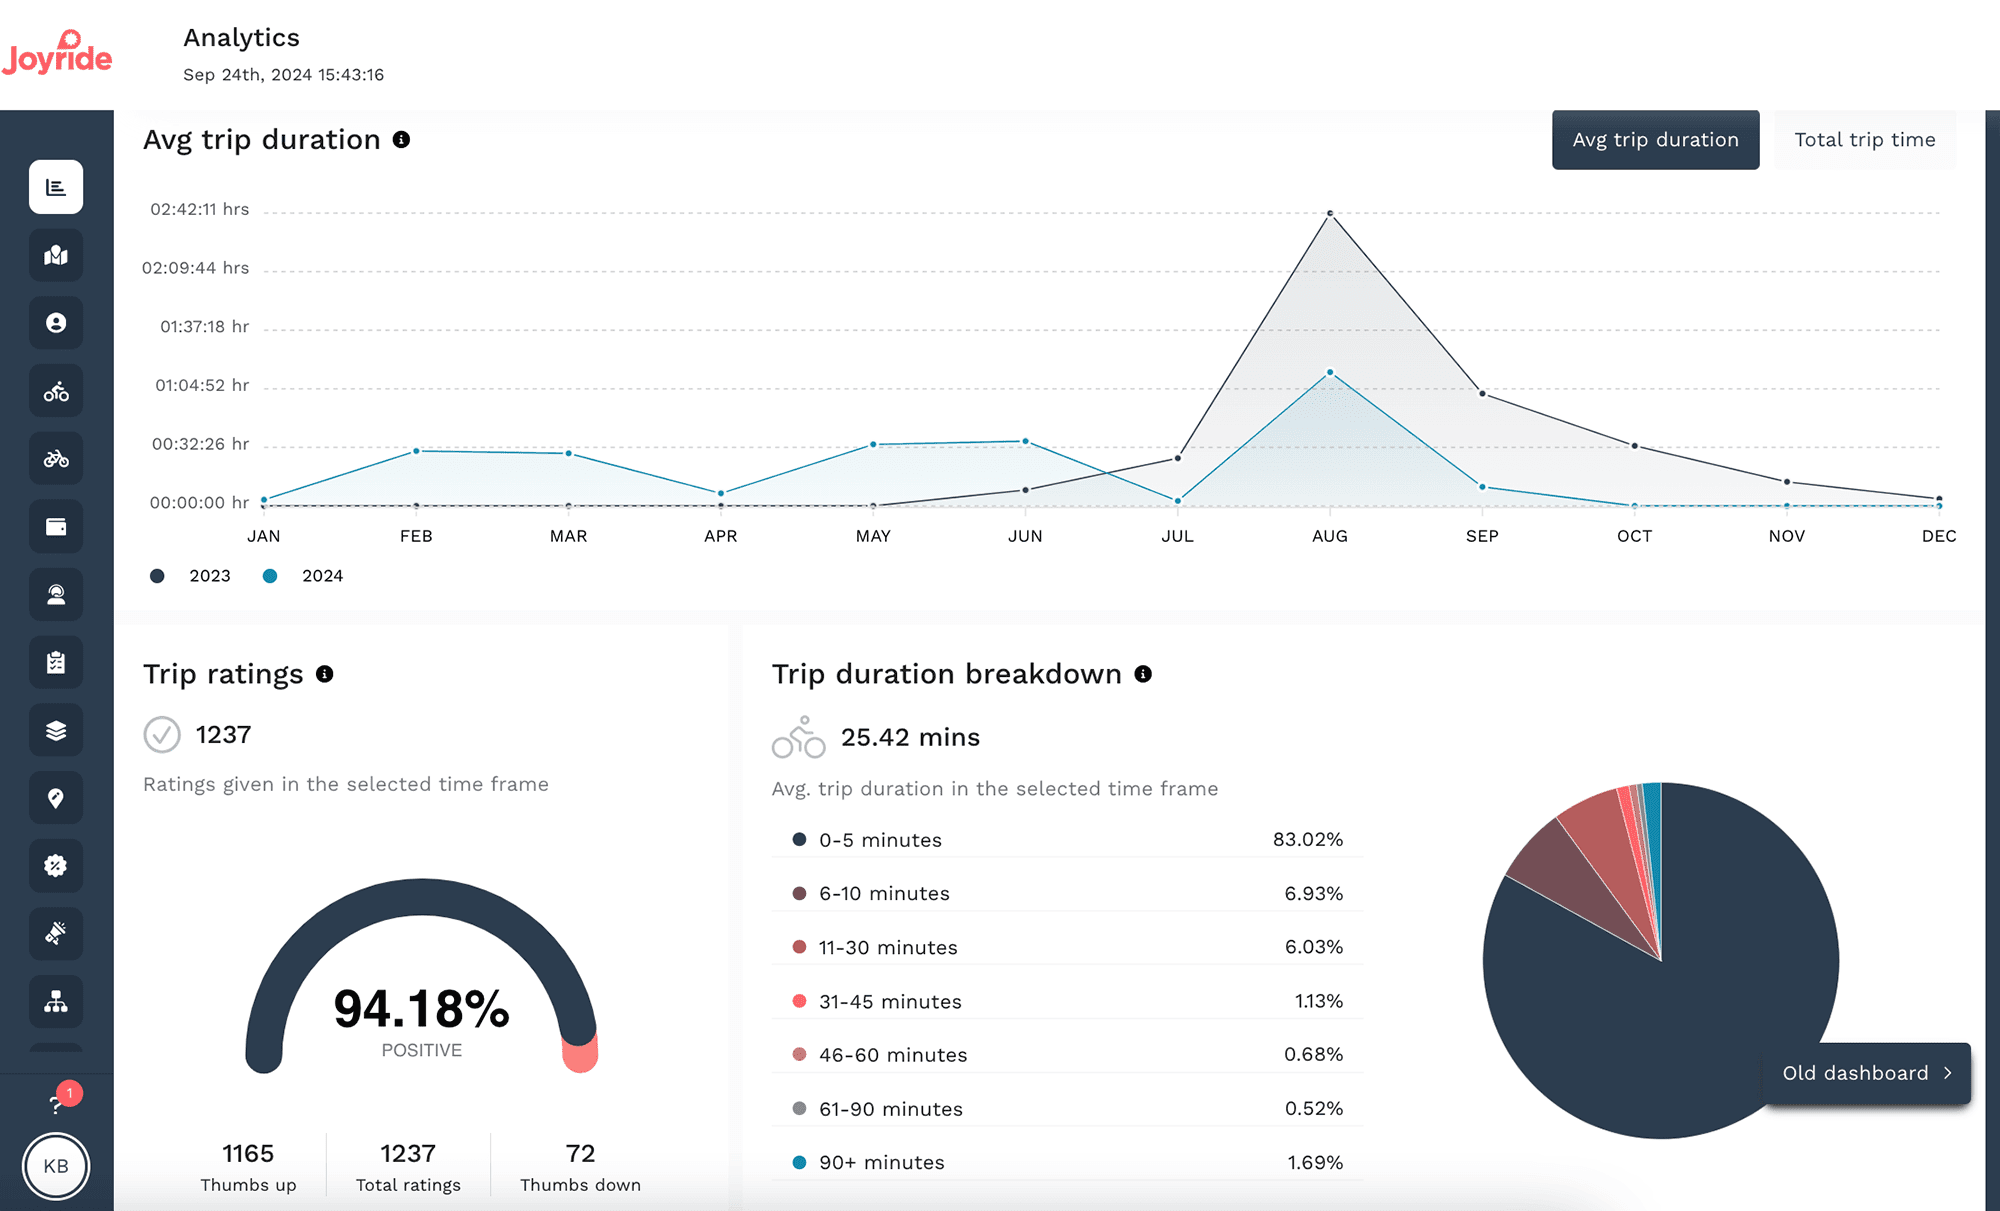
- Number of Trips: Visualize monthly trips to spot peaks and troughs in ridership.
- Average Trip Cost: Track trip costs and user behavior to refine your pricing strategies.
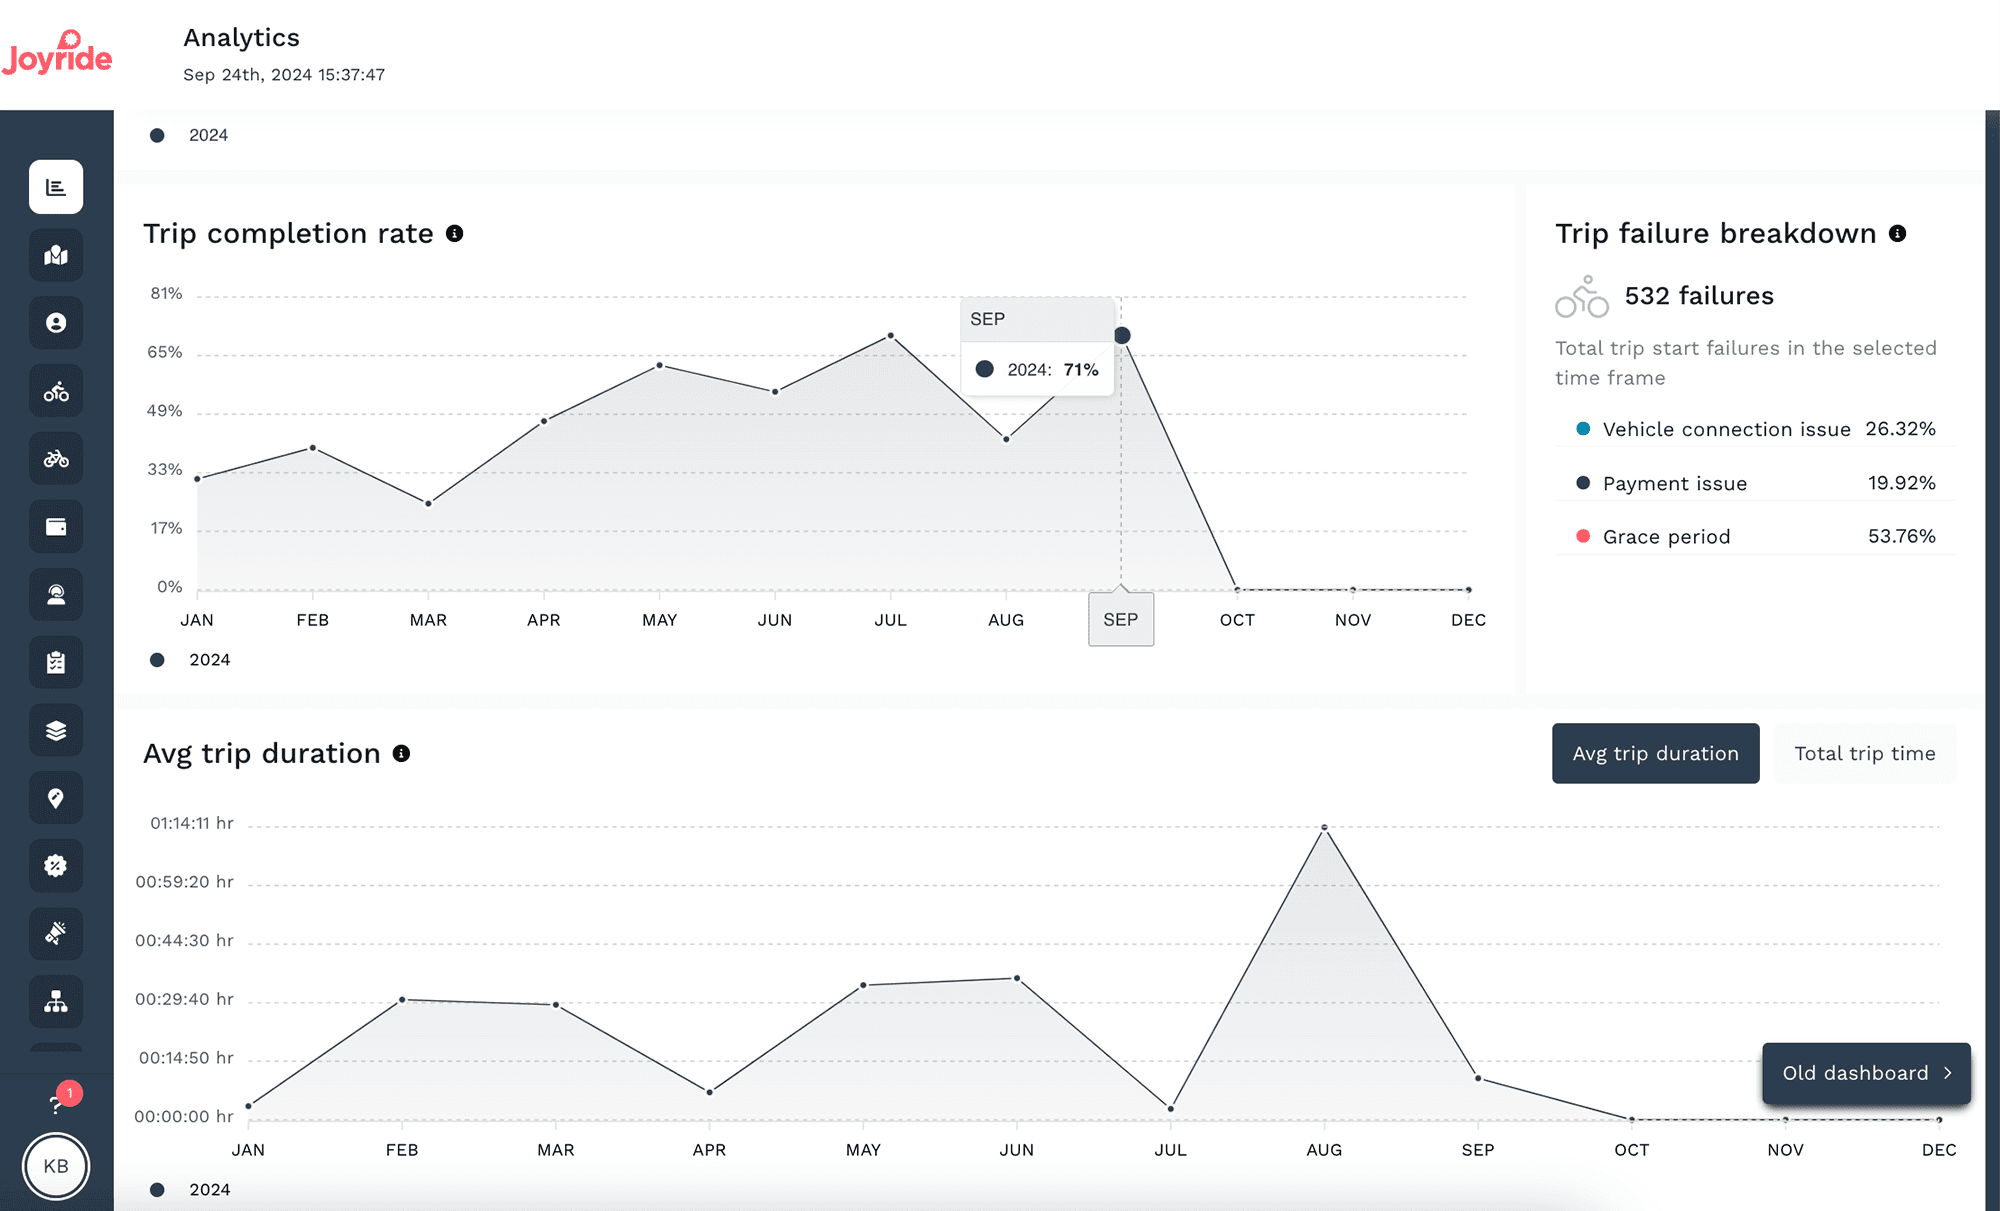
- Completion Rate & Failure Breakdown: Analyze successful trip starts versus failures to pinpoint technical issues and recurring issues in the rental experience .
Vehicle Performance
- Number of Vehicles: Monitor fluctuations in fleet size to plan for future expansions.
- Vehicle Availability: Keep uptime up–more vehicles available means more opportunities for rental revenue.
Promotions and Referrals
- Passes and Promo Performance: Review how passes and promotions perform to optimize your marketing strategies.
- Referral Users: See how effective your referral programs are in attracting new users.
Support Insights & Work Order Management
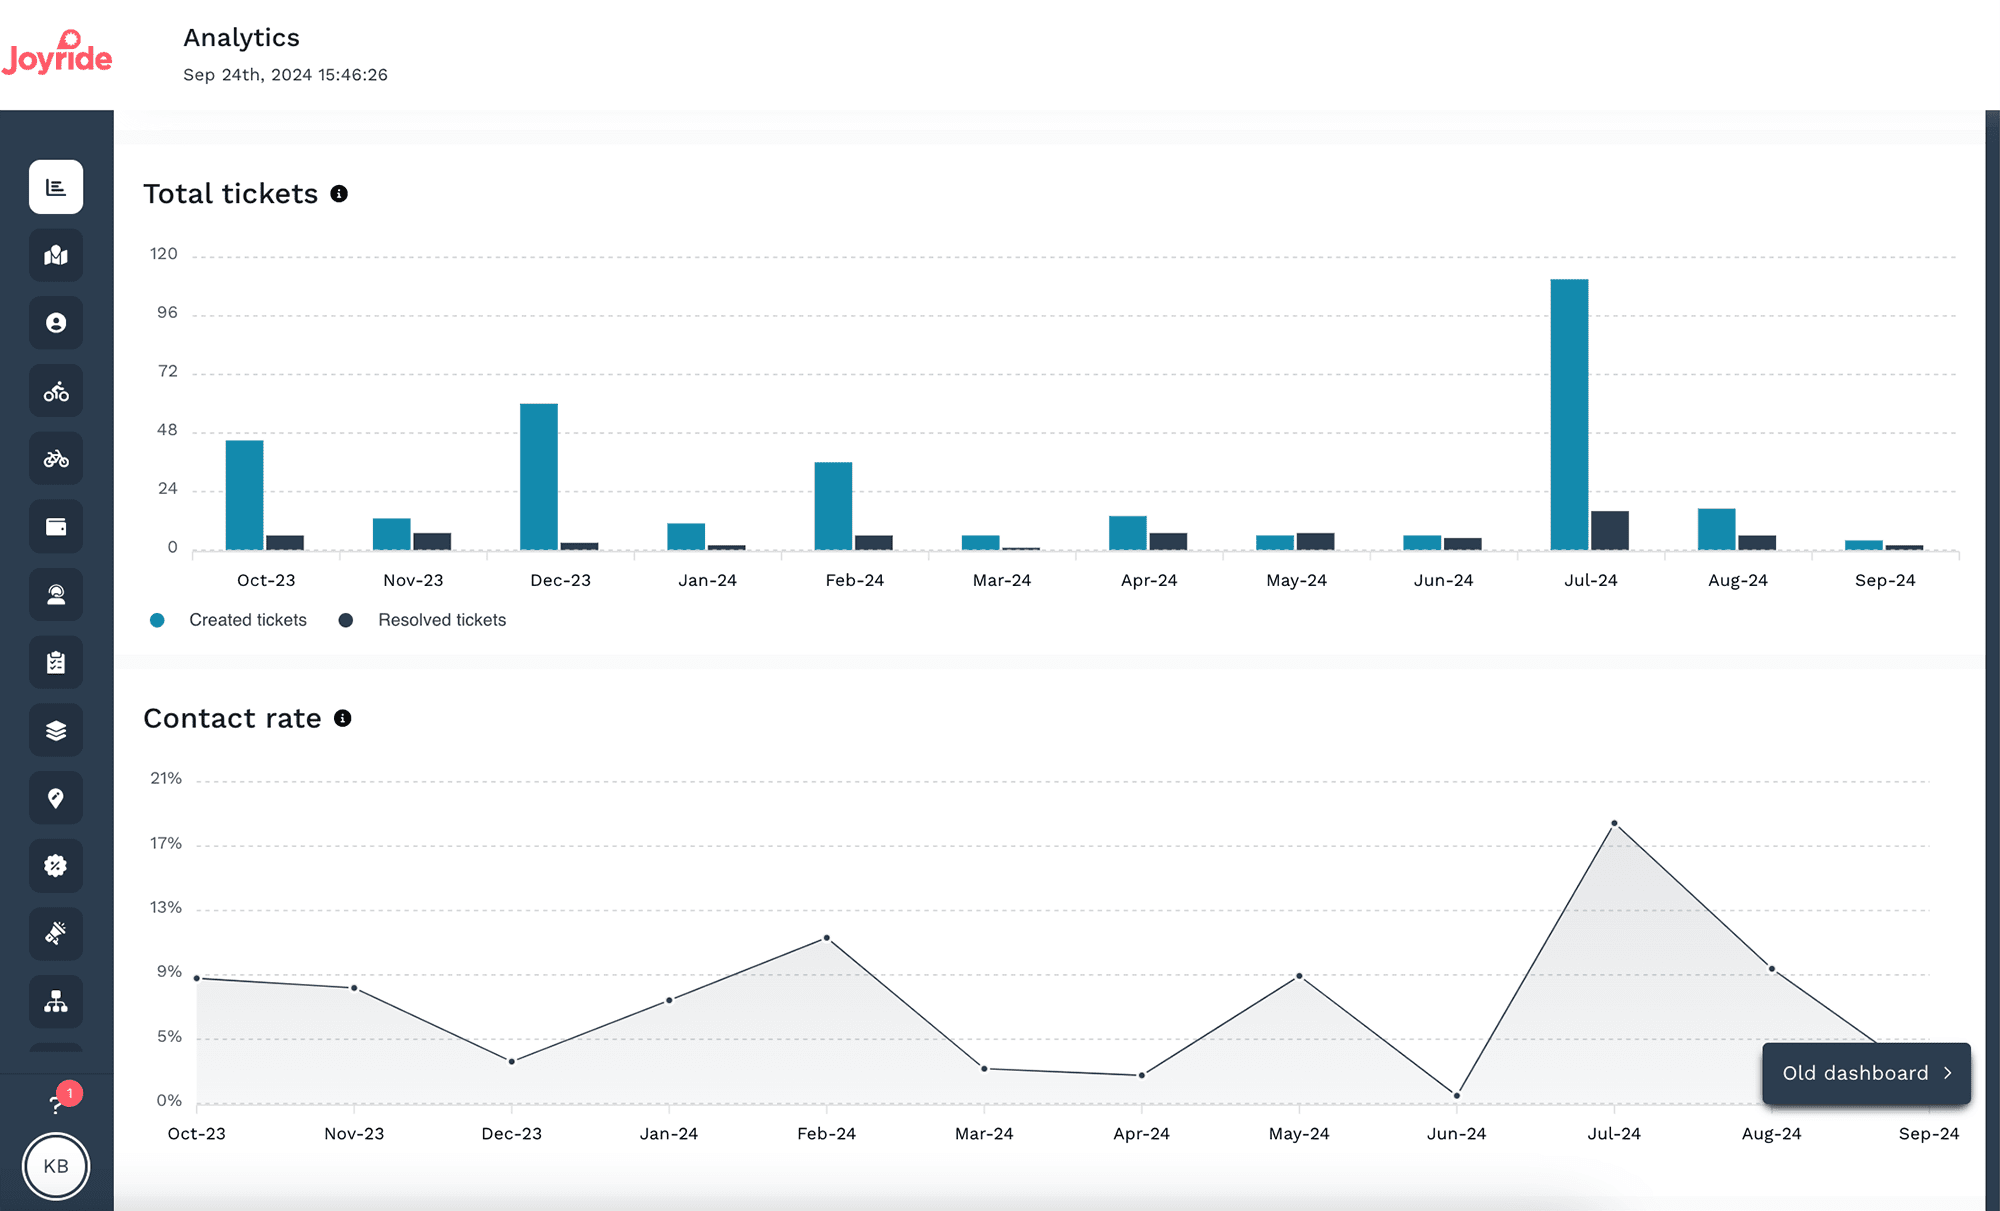
- Created & Resolved Tickets: Look at customer support trends to identify areas for improvement.
- Resolution Time: Keep track of how quickly issues are resolved by your support team.
- Created & Resolved Work Orders: Monitor maintenance activities to improve internal processes.
Why this matters for your mobility business
Joyride’s Payment and Advanced Analytics features put a wealth of data at your fingertips. But it’s not just about having more data—it’s about having quick and easy access to the right data.
Whether you’re managing an urban fleet, or renting golf carts by the beach, these tools will help you do it all more efficiently, leaving you with more time to focus on growth.
Ready to power up your fleet performance?
For current Joyride operators, there’s no better time to transition to our speeder, smarter fleet management dashboard. Payment and advanced analytics are ready for use, and at no extra cost.
For those looking to migrate from another platform, or start your shared mobility business venture with us, contact our sales team and immediately tap into the most powerful fleet analytics on the market.

